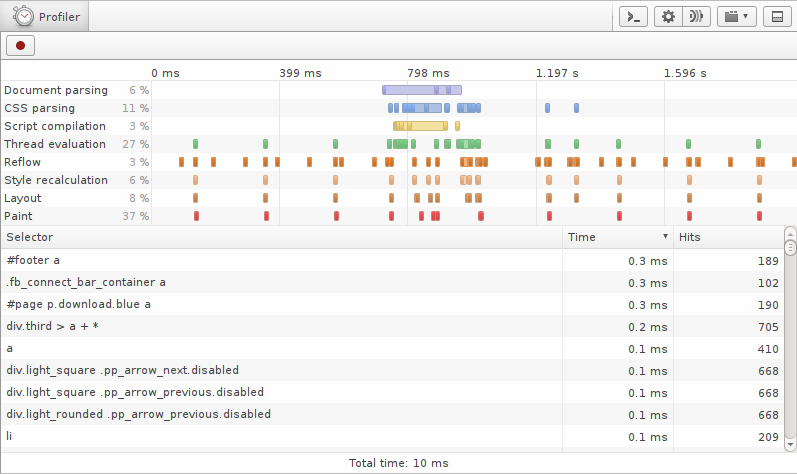
Style profiler preview
CSS selector matching is often neglected when it comes to performance of web documents and applications. For small documents, the performance impact is negligible, but for documents with a large DOM (like the Opera Dragonfly application itself), a single "bad" selector can have a serious impact.
CSS selector matching refers to the process where a browser tries to match a selector against an element in the DOM. In terms of performance, some selectors are better than others. For instance, an ID selector is better than the universal selector (*), because the former only matches one element (and is cached). Matching elements in a big DOM against many unspecific selectors might cause your page to render significantly slower because of the number of elements affected.
We recently introduced support for style profiling in Core, and this is the first preview of its implementation in Opera Dragonfly.
Opera takes several actions from the time it loads a document to when it is rendered on screen: markup, stylesheets and scripts are parsed, scripts are executed, parts of the page are painted on screen. All of these events that occur while rendering are presented in a timeline in this profiler. Our focus has been on providing detailed information about CSS selectors. Clicking the "Style recalculation" header, or one of the individual style recalculation events in the timeline, will give you a list of the most expensive selectors.
Note: This is a special build of Opera Dragonfly – the functionality has not yet been merged with either the experimental or cutting-edge builds. Only the Profiler tab is available. To test, grab a recent Opera build (11.60 or 12) from the Desktop team blog, and set the Developer Tools URL to:
https://dragonfly.opera.com/app/profiler/Keep in my mind that this is an early preview. Lots of things will be tweaked before this is released.
As a real-world example of how big the impact can be on performance, I made a test with the full HTML5 specification downloaded locally and ran the profiler. I noticed a few of the most expensive selectors had ":link" and ":visited". I changed these to instead be "a:link" or "a:visited" (in this case they were equivalent in terms of which elements matched). This trivial change makes the engine use a cache, and brought the selector matching time down from about 14 seconds to about 11 seconds.
Apart from detailed selector matching performance, you can hover on events in the timeline to get more information about them. For example, when you hover on a paint event, it will show the point in the viewport where the paint event occurred, and how big the painted area was.
This is only the first part of a Dragonfly profiler. A JavaScript profiler is on the roadmap, so keep your eyes open.