An update on Network and color values in CSS
Lots of changes in the Network inspector have now made it into an experimental build. The main purpose of the makeover is to give more insight on what happens on the Network side of Opera, with powerful new filtering and search functionality.
The type filter now lets you narrow down the view to certain types of Resources. In addition, you can also look only at the Resources that were requested via XMLHttpRequest. Also you can use CTRL/CMD + click, to combine multiple filters. 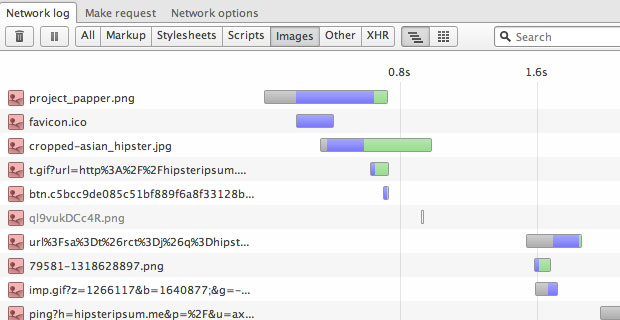
We have added an inline search, which works consistently over the URL list, table view, and in the details. 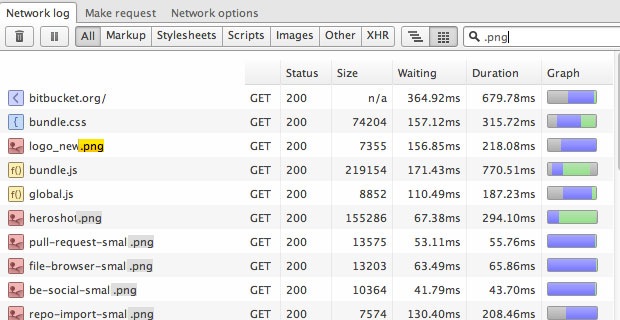
The graph view now uses specific colors to represents the different phases of resource retrieval as segments within each row. A new tooltip lets you see a sequence of internal events in Opera that occur during the retrieval and how much time was spent on each. Note that the values represent the time elapsed between two events. 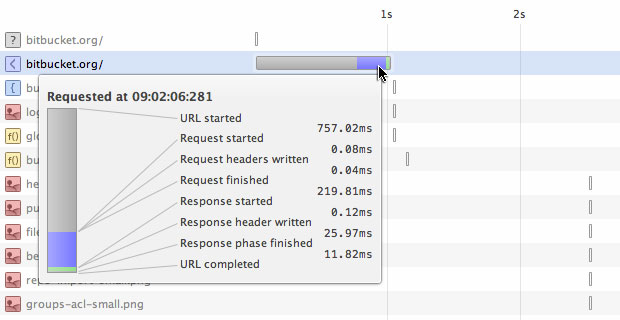
Although the standard graph view is useful for visualizing the loading flow, sometimes developers may be more interested in picking out specific data about their requests. You can now switch from flow view to a table view, which can be sorted and further customized via the context menu. 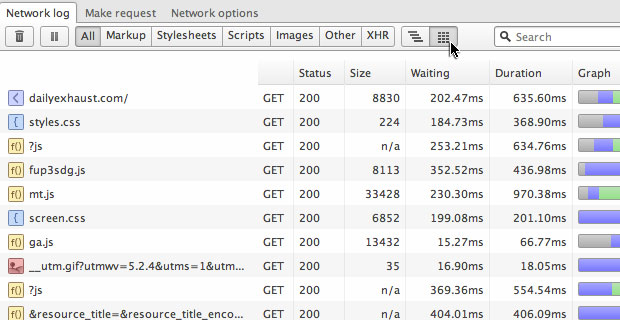
Selecting each line will provide the specifics of each request in the Details view, which shows the actual request and response of each network activity, including headers and body. This view has been streamlined: headers are split into key/value pairs, and the response body is shown inline. 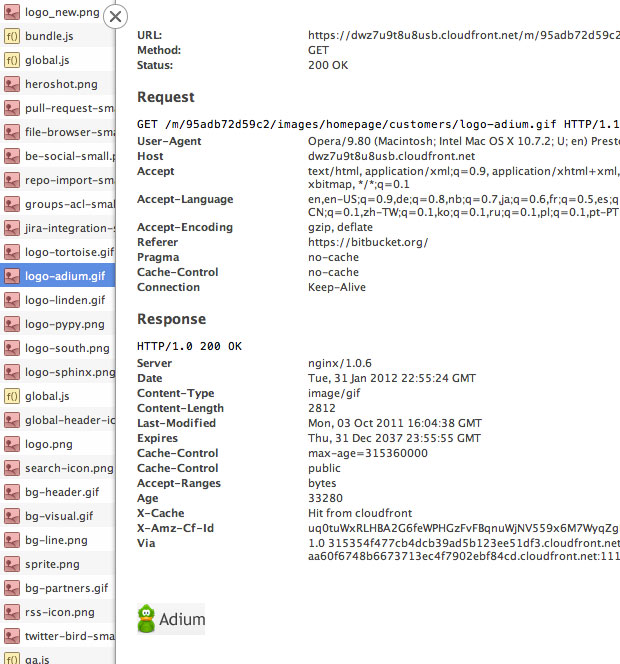
Most of these UI changes are still work in progress, but they should give you an indication of where we're heading. A few known issues:
- The line-height of tables can get out of sync with the list of URLs on the left-hand side
- Content tracking is not enabled by default, but available as a toggle in the Network options tab. Without tracking, the response body will sometimes not be shown in the Details view
- The search may sometimes match parts of the UI itself
- The layout in the details view sometimes breaks due to long headers or body
- Timing information in the Network view is not accurate, as it can be affected by other debugging activities in Opera. In general, the loading flow will be slower when Opera Dragonfly is running. We plan to address this issue with a special network-profiler mode, which is on the roadmap for later this year.
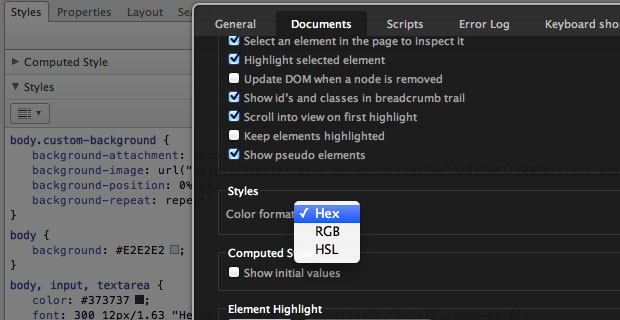
But wait, there's more! As a bonus, this build also includes some new features in our Style inspector. We now show color swatches next to all color values. And – as hotly requested by many of our users – it's now possible to use your preferred color format: Hex, RGB or HSL (which can be changed in Settings → Documents → Styles). Other changes include clickable links (which open in the Resources tab) and a streamlined view in the Computed Style panel.