Enhanced Network Logger
As announced recently for the experimental path, we are now releasing an all new Network Logger on our stable path. Here is a summary of what's changed:
The URLs on the left-hand side are shortened. This should make it easy to spot the one you're looking for. The full URL is shown in a tooltip, which also provides you with a handy list of GET parameters.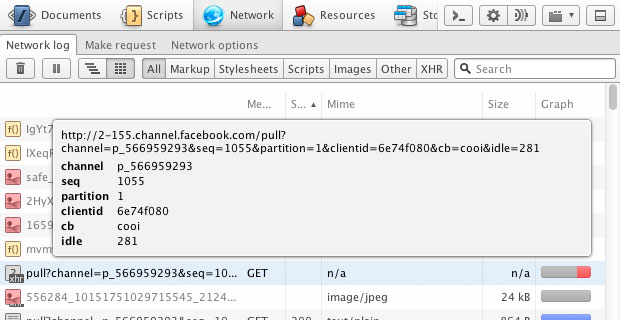
The request waterfall has also been given a new color scheme. As before, you get color-coded icons for different resource types in the URL list, but in the timeline we now indicate how the time was spent fetching the URL. What happens once the browser asks for a URL is shown as a sequence of phases. They fall into categories like scheduling (grey), sending (red), waiting (blue), receiving (green) and processing (grey). Occasionally requests have to be retried or they are aborted – these actions, and the related phases, are mostly show in yellow. We tried to follow existing UI conventions a bit, so you don't need to learn the color-coding idiosyncrasies for each developer tool you might be using.
In the example below, you can see that to complete the request for photos_upload.php the browser took some time to write the actual request (red), waited for the request to be sent over the network and processed on the server side (blue), and then spent a little time to receive the response (green).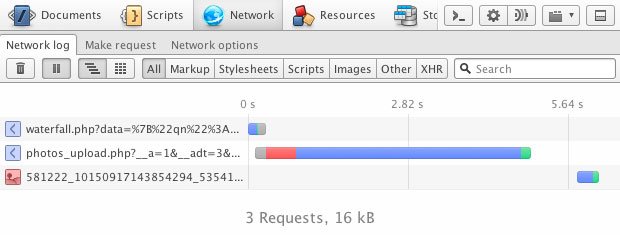
For an even more detailed view, there's a tooltip on the loading graphs, which provides you with a detailed, high-res timing breakdown for each step of the various phases.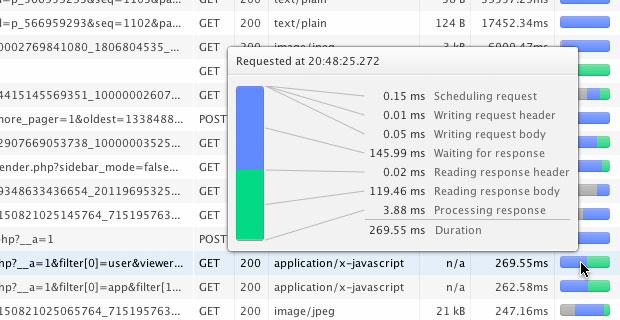
If you don't particularly care much about the specific timing and sequence of your requests, you can now also switch to a Data view, which presents all Methods, Statuses, MIME type etc. in tabular form. This table can be sorted by clicking the various column headers, and you can filter the table to only show particular types of resources (such as Scripts, Images or XMLHttpRequests). You can select multiple types of resources by using ⌘+click / Ctrl+click. Opera Dragonfly will remember your choice of sorting and filtering next time you access the Network panel.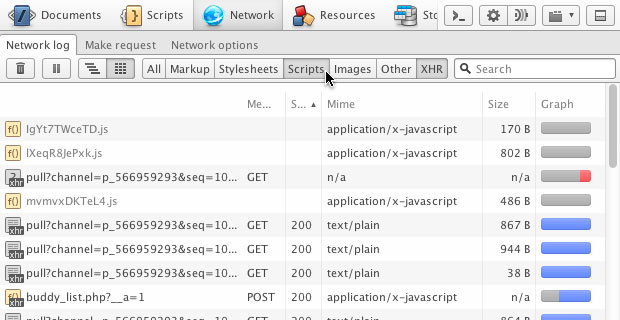
Clicking on a particular request will bring up an overlay with all the details associated with that request. This data view can be resized and you can quickly move to the detailed view of another request by using the ↑ and ↓ cursor keys.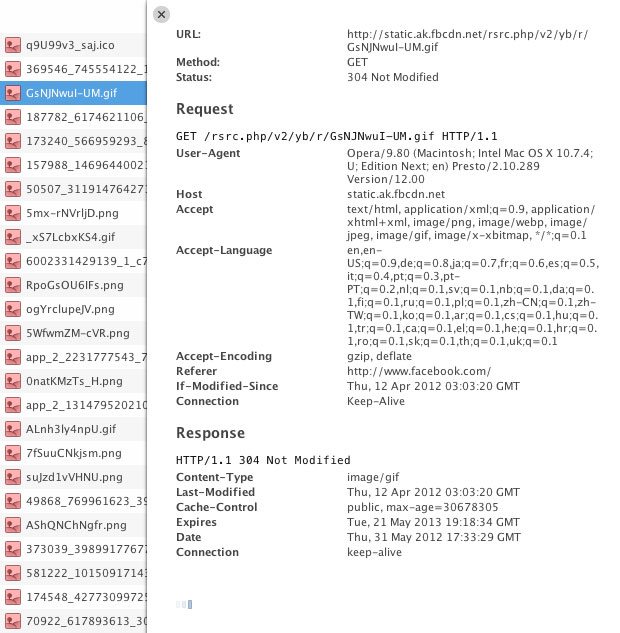
In addition, this latest release has now been localized in 33 languages – if you used a localized version before, and parts of the UI were still in English, this should now be fixed.