Experimental build with event listener inspection and function source tooltips
Our latest experimental build introduces the ability to inspect JavaScript event listeners from inside the DOM view.
As these new features rely on functionality that's only recently been added to our browser core, they're currently only available if you're running Opera Next.
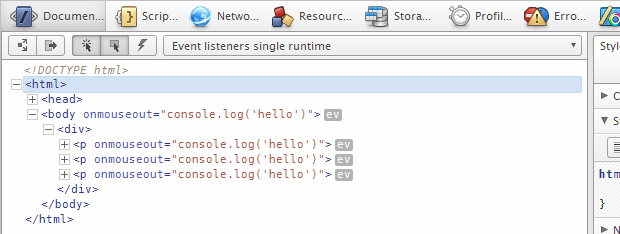
Elements with an attached event listener are presented with a new icon in the Document view. Hovering the icon opens an overlay with the list of listeners.
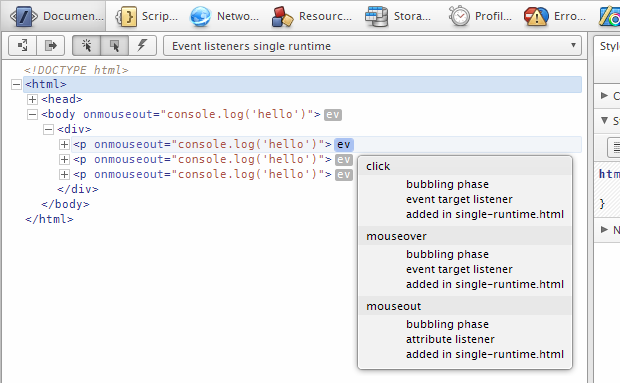
Each listener has an entry showing the event type as title. The next line shows if it listens in the bubbling or the capturing phase. If the listener was registered with addEventListener or set as 'on'-event-type its type is 'event target listener'. Listeners set as markup attributes are 'attribute listener'. Hovering that type shows the according listener callback in a function source tooltip.
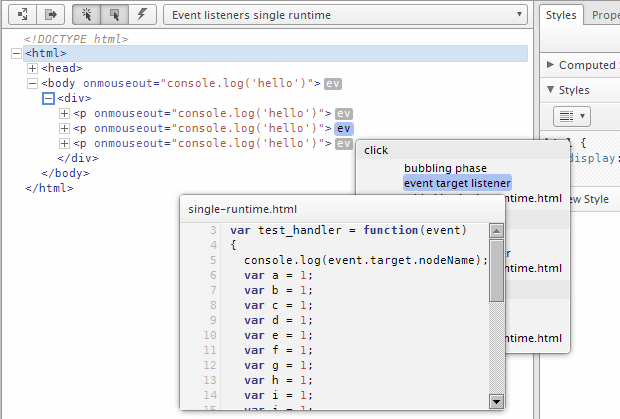
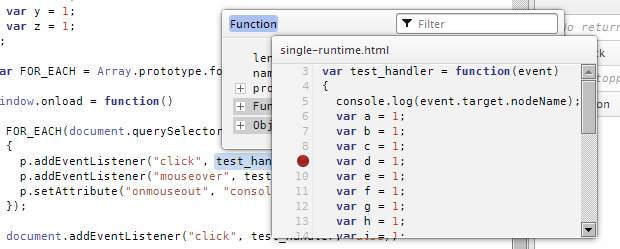
Breakpoints can be set directly in that tooltip. Clicking the title of the function source tooltip switches to the Scripts tab and highlights the corresponding function in the source file.
The last line of a listener entry in the overlay shows where the listener was registered. Again, clicking this line switches to the Scripts tab and highlights the corresponding line in the source file.
To complement the inspection functionality in the Document view, there is also a new Listeners side panel, which gives an overview of all listeners that are currently active, ordered by event type. Each of the event types type can be expanded to show all nodes with an according listener.
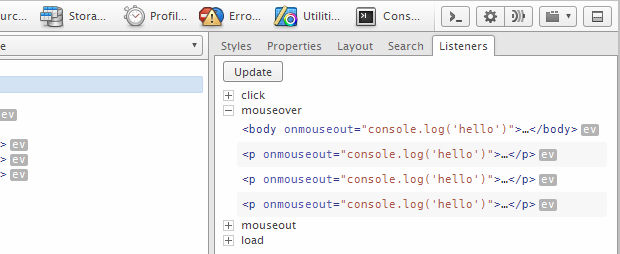
The panel provides a static snapshot of registered event listeners – but as event listeners can be programmatically added, modified or removed frequently, the Listeners panel also features an update button which will refresh the snapshot view.
As a bonus, the new function source tooltips used in the event listener overlay above have also been added to other parts of the JavaScript source view. This can be handy to set breakpoints directly in a callback.
We hope that these new features will be a useful addition for JavaScript developers. As always, we value your feedback and suggestions.