Profiler lands on default path
Today we're releasing the profiler that's been in beta testing for some time now.
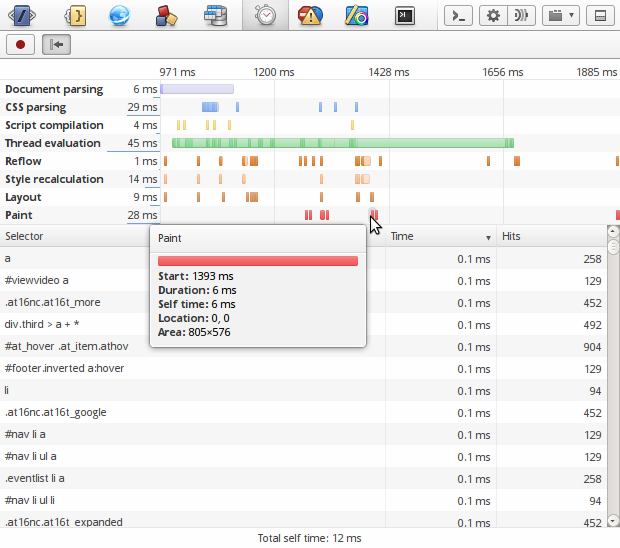
The profiler lets you record all events that happen on a web page, for example script compilation and reflow. When recording is stopped these events will be presented in a timeline where you can see how long each event took.
Events in the timeline can be hovered to get more information and some can be clicked. For now only style recalculation events can be clicked and will show a table of selector matching events with detailed information.
Future releases will add the possibility to profile JavaScript.
As can be seen from the screenshot we now also make tabs smaller when the space is narrow. We also have a feature in this release which improves timing accuracy in the Network by turning off unneeded debugging services. This will be especially noticeable when remote debugging.