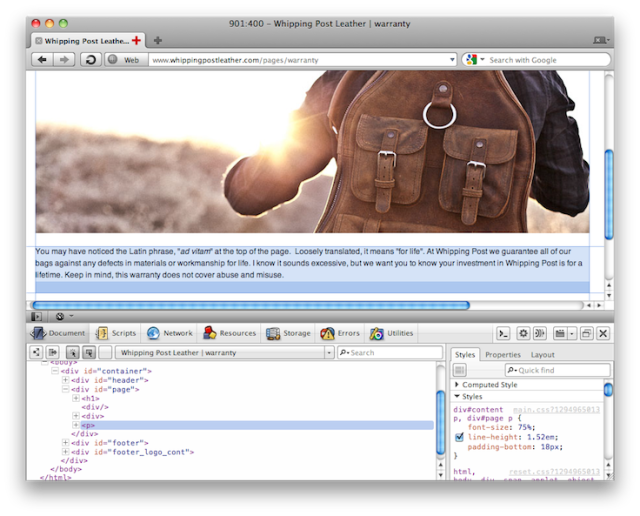
Another experimental preview to test
Progress towards Opera Dragonfly 1.0 marches on, and we have a new build on the experimental path for you to try. This build comes with a number of changes:
Opera Dragonfly Framework

Hybrid layout
We’ve combined the two previous versions of the panel layout. The side panels retain the original tab layout, while the main panel looses the tabs, as seen in the previous build. However, related side panels have been merged under one tab. An example of this is in Scripts, where the Call Stack and Inspection now sit together. This allows the call stack to still be visible while inspecting the properties in the execution context.
Unified attached/detached mode
Attached and detached mode now share the same style and layout. This avoids confusion with the layout changing and allows us to put all energy into perfecting one mode. A detached optimised layout may return in a later version.
Styling improvements
- Floating window styling
- Updated context menus to a more toned down white theme
- Improved readability of the keyboard bindings preference panel
- Added press state to the Command Line button
Filters
The Quick Find search fields in the side panels have been changed to act like filters. Searching for a term will filter the views to show only properties that contain the search term.
Context menus
Further work has been done to complete the context menu support in the various views. This should improve the discoverability of the editing features, amongst other things.
Remote Debugging
The visual feedback has been improved when in remote debug mode. When a connection is established the icon animates to notify the user. When a connection drops or fails, the icon turns red and displays an error message.
Storage Inspector

There is an entirely new Cookie Inspector which is available for Opera 11 and above. This has a number of improvements over the old service, including:
- Expanded information about cookies, including fields for domain, path, secure and http-only
- The cookie list can be sorted and grouped
- Deleting cookies works more consistently
- Fuzzy dates for cookie expiry date
JavaScript Debugger
Scrolling performance and keyboard accessibility have been improved.
DOM Inspector
The styling of the in-page host highlight has been updated.
Network Inspector
Work continues on the new version of the network inspector. This is still largely unstyled. New features include:
- Added support for showing network details and content bodies
- Added network option to switch on/off content tracking
Resource Inspector

A number of updates have been made to the brand new Resource Inspector. These include:
- Added missing icon
- Updated styling for resource list and resource meta data
- Ability to group by host or resource type
- Ability to enable and disable columns in the resource list
- Syntax highlighting for JavaScript source
Known issues and missing features
Some known issues and missing features from this build include:
Event breakpoints are missing from the Scripts view(now fixed)- Network view is mostly unstyled
- Scroll bars and timeline rendering is a bit broken in the Network view
- Only JavaScript files have a customised view in the Resource Inspector at present
- Syntax highlighting in the resource view only works for JavaScript files
- Editing is disabled in the cookie manager
- Both the new and old cookie managers are show
- The colour picker is missing the colour slider image
